
SITE CONCEPT
The main strength of this site is your ability to quickly and easily cross-reference the various dynamic data sets affecting offshore fishing conditions, and we give you the tools to make your own analyses. Each data set (altimetry, sea temps, water color, etc.) has favorable and unfavorable areas on the respective imagery - the key here is to look for overlapping favorable areas...this will really narrow-down where you want to go, and equally important, where NOT to go. Since you have unlimited access to the imagery, you can monitor the site in the days preceding your trip to observe the tendencies of the different imageries, and it's a good idea to print out the different imageries for each day and place in a log book. You should therefore have a definite idea of where you want to go before you even leave the dock.
EXAMPLE: When I want to go fishing, the first image that I'll look at is the Altimetry, which shows where the nutrient-rich (upwelling areas) and the nutrient-poor (downwelling areas) are positioned. Once I have determined which areas are favorable, I make a note of which waypoints are located in the favorable areas. This will allow me to reference the different imageries against one another relative to the same waypoint locations. Usually the second image I will then look at is the Sea Temp Imagery. Depending on what species of fish that I am after, the Sea Temp Imagery will show which areas contain optimal temperature areas for that species (this applies mainly to pelagics, as reef fish tend to stay on the structure where they live). Another key feature of this imagery is your ability to pinpoint the tempbreaks which indicate the location of rips/weedlines - you can optimize the imagery based on your own specs to pinpoint subtle tempbreaks; refer to Sea Temp Imagery for more info on that subject. Thirdly, I'll pull up the Chlorophyll (Water Color) imagery and look at the water color in the area that I'm interested in going...I can see which waypoints are located in green water vs which ones are in blue water.
Let's do an example cross-reference of the imagery... Say, I'm heading off the Mississippi Delta and I want to target the deepwater rigs and Floaters. Here's the imagery, and how to read where to go - I'm starting off with the Altimetry...
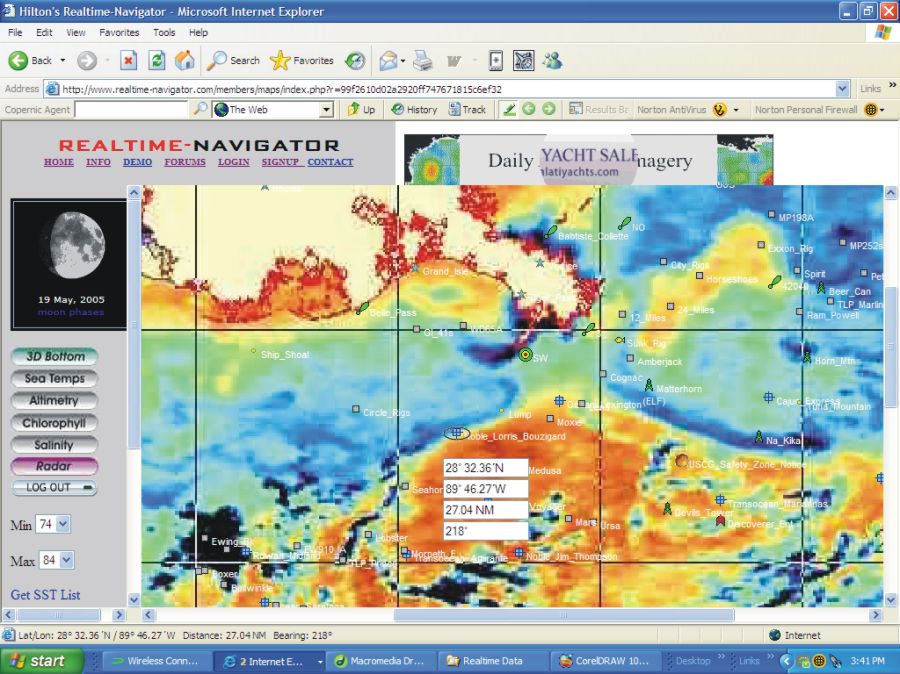
Here's a shot of the Altimetry where you can see the Loop Current at the bottom of the image (positive isobars, yellow/red color), and a fairly intense cyclone positioned all around the Delta (negative isobars, dark blue color). This shows which rigs/floaters are positioned favorably, which are borderline, and which structures are positioned unfavorably (I WOULD NOT go to the Deepwater Nautilus, for instance). I've got the SW Pass buoy set as my starting point for my Nav Tool, and have the Nav Tool positioned over the Noble Lorris Bouzigard, showing that it's almost 27 nautical miles from the buoy. Noble Lorris Bouzigard is also positioned very favorably in the altimetry imagery, sitting very close to the -10 isobar. Now let's look at the Sea Temp Imagery....
The Sea Temp Imagery shows one heck of a tempbreak running +_ East/West about 15 miles south of the Delta. As you can see, the Noble Lorris Bouzigard is positioned right on this break...so now, we have 1) Structure -Noble Lorris Bouzigard, 2) Tempbreak which equates to a great weedline here, 3) Favorable Altimetry position. Hmmm, looks like this Floater would be a great place to hit right now. Speaking of Floaters...the position of the Floaters is dynamic information in itself, and we track their positions every week. As you can see, the dynamic position of the Floater relative to other dynamic information (such as Sea Temp Imagery) gives you a better idea of the overall picture of what's actually happening out there, eh? Now let's look at the Water Color...
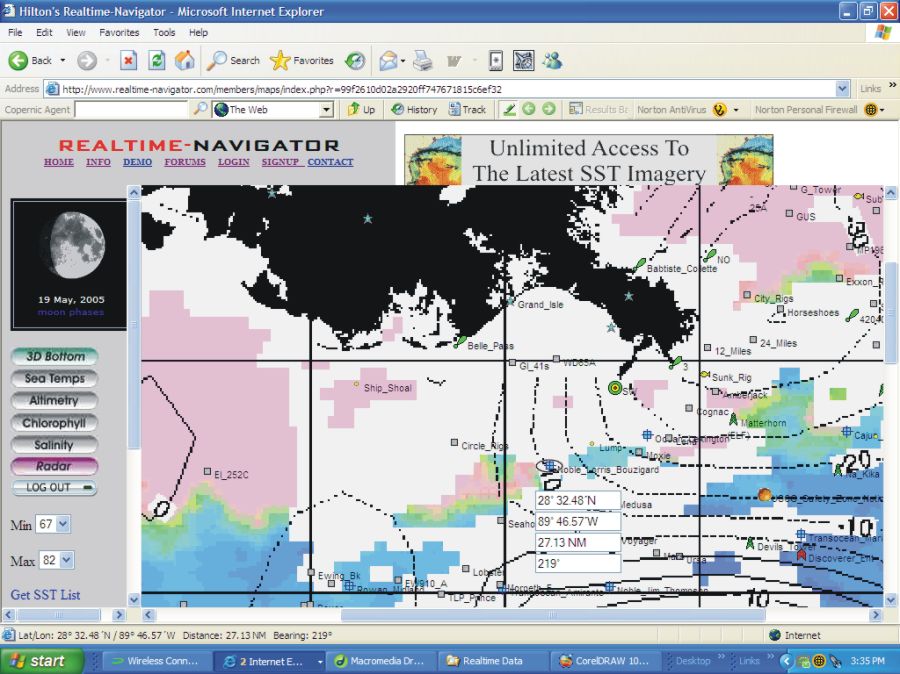
Well, this Chlorophyll (Water Color) image is not the best in the world - I don't know why, but this imagery is quite sketchy to capture. The pink color equates to green water, with yellow, green, and light blue equating to blue-green, getting bluer. Dark blue equates to cobalt blue water, and white equates to clouds (no data). Although the image is somewhat sketchy, I can extrapolate that the Noble Lorris Bouzigard is situated on a water color change (which confirms the Sea Temp Imagery, as there is most likely a water color change on that tempbreak shown above). Now, one last thing, what is the bottom topography like in this area?
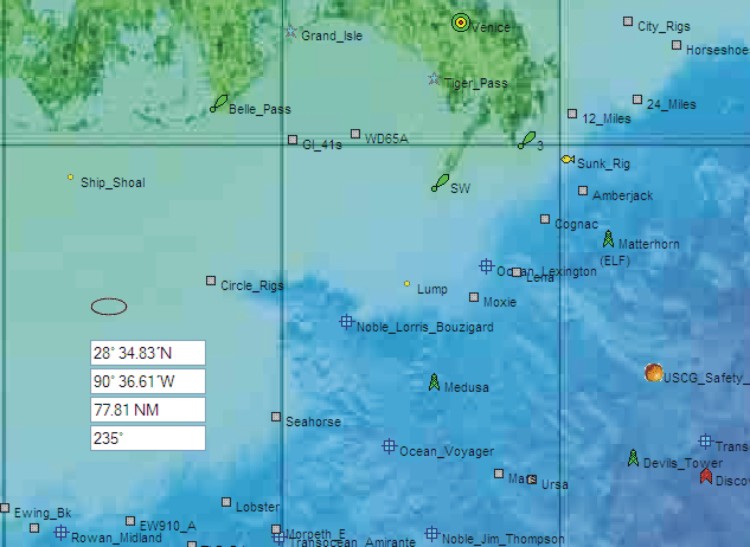
Looks like the Noble Lorris Bouzigard is situated very favorably on the edge of the Mississippi Canyon. The information contained in the Floaters section of the site tells us that it's located in 1,139' of water, that it arrived on that spot on May 11, 2005, and that it should stay on location until mid-June...Here's reason #5 to go there. LET'S GO!!