SEA TEMPS
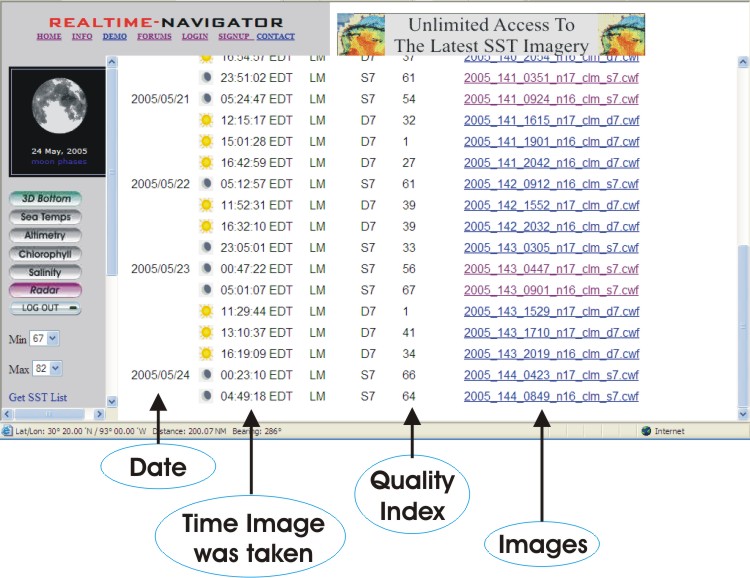
Sea Surface Temperature is an important component of offshore fishing conditions. Our site provides you with unlimited access to this dynamic data (usually 4 to 6 images per day), geo-references it, and brings it in as your chart background. Since it's your chart background, you can see it's relationship to waypoints of interest, and you have the ability to pinpoint the location of notable tempbreaks, etc. When you click the Sea Temps Button located on the left Nav Bar, you will hyperlink to the image index page, as shown below.
You can see that on May 23, there were 5 images available and that so far on May 24, that there are 2 images available; one shot at 12:23 AM and one shot at 04:49 AM. Both of these images should be of very good quality, as the Quality Index is ranking them at 66 and 64 respectively. The Quality Index measures how much image is clear to the satellites - the satellites cannot see thru clouds, so the more clouds there are, the lower the Quality Index ranking. If you have a Quality Index of 40 or above, you should have a useable image - it just depends where the clear area on the image is located. You may luck out and have the area that you're interested in open to the satellites even though it has a low Q.I. ranking. I have never seen a Quality Index Ranking in the 80's - if it's in the 70's it's a GREAT image! These images are "WYSIWYG" (What you see is waht you get) and are not processed to make them look better - therefore, the information given is very accurate. Now, let's open up that 66 image from this morning....

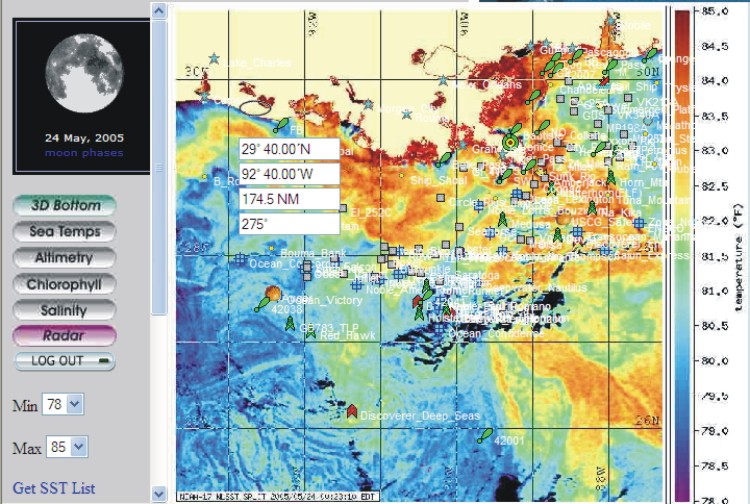
When the image comes up, the colors are based on a default temp range that we set - right now it's based on a 72 to 84 degree range, but as you can see, it's fairly washed out and needs adjustment. YOU have the power to tweak the image to your specs - let's correlate the colors to the temperatures shown on the temp range to the right of the image...I'm going to say that the top end should be 85 degrees and the lower end should be 78 degrees. Look at the left Nav Bar, and you'll see two little windows; "Min" and "Max"...plug in 85 in the "Max" window and 78 in the "Min" window. Then hit "Get SST List". The program then goes thru and re-paints all of the sea temp images to this new 78 to 85 temp range and takes you back to the image index page - click on the 66 image once again, and this is what it now looks like.....
Now, I'm going to zoom in. Before I do so, I'm going to click on the NAME "SW" of the SW Pass buoy. This will cause the bullseye to replace the buoy icon - the Nav Tool (the oval with 4 white boxes beneath) always reads from the bullseye. And remember, the program (when using the Nav Tool) is reading from the tip of your cursor - this is very important if you are to get accurate readings.
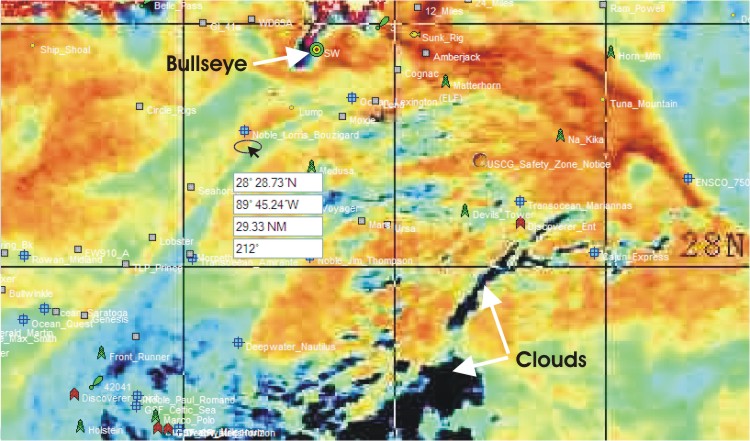
I have placed my cursor inside the oval, and dragged it onto a nice tempbreak just south of the Noble Lorris Bouzigard...it is located at the lat/long position indicated, and is 29.33 NM from the SW Pass buoy at a heading of 212 degrees. Print this and take with you on the boat, as the print contains the nav data to put you on the spot as well as a graphic showing the conditions in the area.
Good luck, and give me a fishing report!
Tom Hilton