TUTORIAL
THE SITE CONCEPT
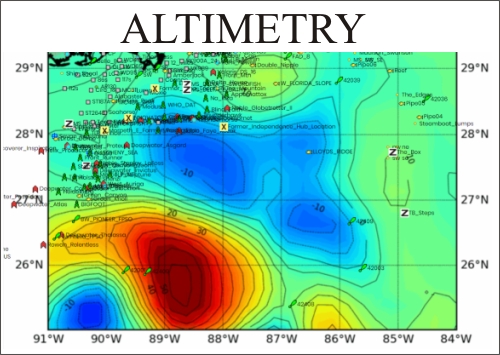
Yes, there is a learning curve to learn how to best utilize the site, but it is not rocket science - once you understand the basics, it's like riding a bike. The main strength of this site is your ability to quickly and easily cross-reference the various dynamic data sets affecting offshore fishing conditions, and we give you the tools to make your own analyses. Each data set (altimetry, sea temps, water color, etc.) has favorable and unfavorable areas on the respective imagery - the key here is to look for overlapping favorable areas...this will really narrow-down where you want to go, and equally important, where NOT to go. Since you have unlimited access to the imagery, you can monitor the site in the days preceding your trip to observe the tendencies of the different imageries, and save the different imageries for each day to refer to sometime later. This is a great learning to to help understand where you want to go before you even leave the dock.
GETTING STARTED
SAT2NAV INTRODUCTION
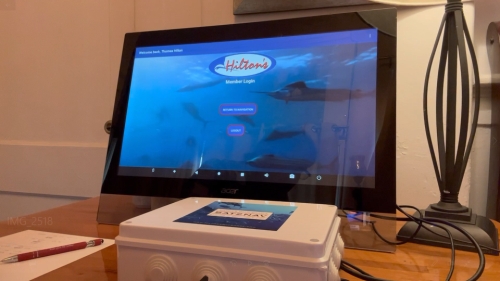
SAT2NAV INTRODUCTION EPISODE 2
© 2023 Hilton's Fishing Charts - All Rights Reserved.